Introduction
In my day-to-day project work, I frequently create BI reports for organizations. With the recent rise of AI, inquiries and consultations regarding data utilization have been increasing steadily.
The importance of data has been emphasized for a long time, but organizations that previously limited themselves to superficial operational efficiency improvements are now beginning to understand the significance of data not just intellectually, but through firsthand experience.
It is a very positive trend that opinions about data are emerging not only from dedicated data analysis or planning departments, but also from people closer to the operational frontlines.
On the other hand, a persistent challenge in creating BI reports is that as demands for data utilization grow, "certain requirements inevitably have to be dropped."
This is because report users are diverse. Organization A might say, "We want to view data from perspective X," while Organization B says, "We want perspective Y, and please remove or hide X since we don't need it." Even within the same organization, Person C might request, "It would be nice to also display Z," while Person D says, "I don't need Z, but I'd like to drill deeper into W." Within the limited screen space, various requests emerge, including mutually exclusive ones.
Such diverse requests are entirely natural (and in fact a good thing), since both at the organizational and individual level, job responsibilities differ, and naturally so do the perspectives and granularity each person wants to see.
Ideally, we could create individual reports that address every request. However, since the development team's capacity is finite and post-release maintenance overhead must be kept in check, the approach typically prioritizes the most commonly requested features (AND conditions), aiming for a greatest-common-denominator solution.
As a result, during the requirements definition process, individual requirements that are important to specific people but lack broad commonality must be set aside. The resulting report may maximize the total aggregate value, but when viewed at the individual user level, it often ends up being a 70-80 point report.
This is where the discussion of self-service BI and citizen development comes in. But what business users truly want to focus on is business outcomes, not data aggregation processes, data processing, or SQL design.
Specialization matters. Just as corporate programming training programs have shown that not everyone can become a programmer, having some baseline knowledge is certainly beneficial, but business users should ultimately focus on their business domain. Spending significant time and effort to gain a rough understanding of programming fundamentals, without reaching a practical level, while losing touch with frontline experience and business domain resolution, would be counterproductive.
In this article, I would like to explore how AI agents can be leveraged to bridge the gap between the inherent characteristics of shared BI and the bottlenecks of citizen development, further accelerating data utilization within organizations.
Feature Design
Data Source Configuration
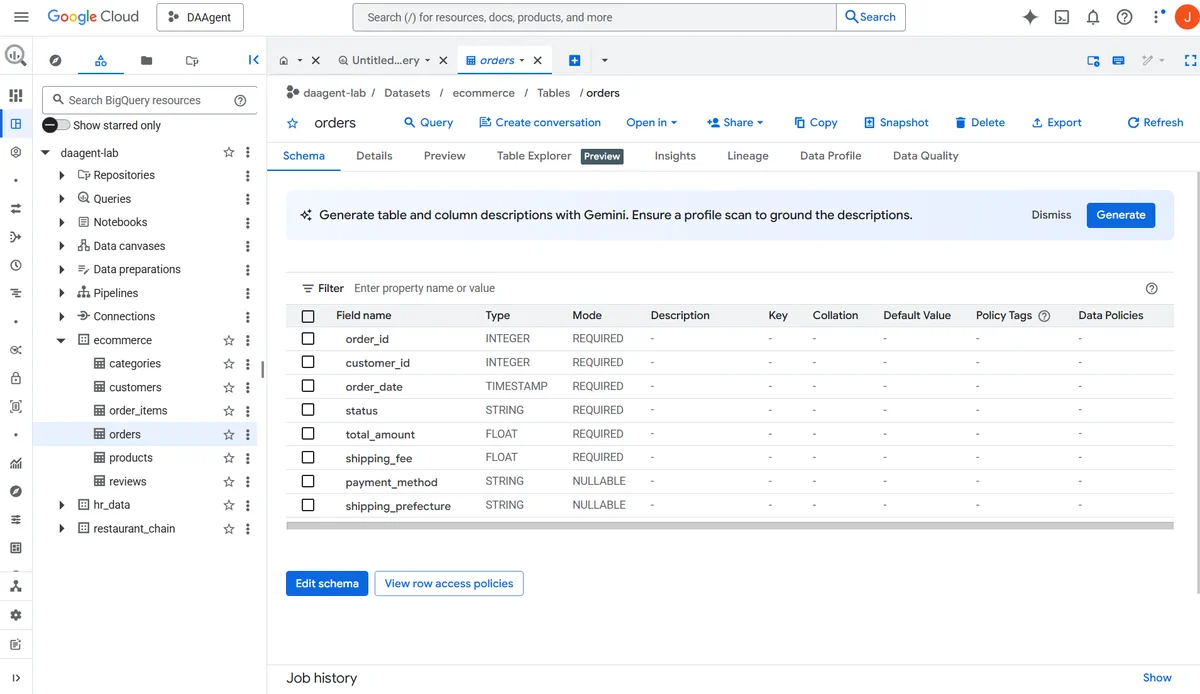
For this sample, we will use a BigQuery dataset like the one shown below.
I am using BigQuery because it is frequently used in my projects, but the database itself can be anything. You only need to adjust the tools that interact with the database (i.e., the tools provided to the AI agent), so Excel or CSV files are perfectly fine for initial or proof-of-concept stages.
On the front-end UI, users can select a BigQuery project and browse its datasets, tables, and columns. From a context engineering perspective, the scope that the AI agent references should be minimized according to the purpose, so we enable data selection at the dataset, table, and column level.
Selecting everything indiscriminately might work to some extent, but providing more information than necessary never improves quality. It is better to narrow the scope of target data according to the purpose. Removing unnecessary tables and columns from within datasets can also improve quality in the subsequent analysis phase.
Additionally, since personal information is often unnecessary from a data analysis perspective, it is advisable to deactivate such columns to prevent personal information from being inadvertently output in subsequent reports.
If personal information is clearly unnecessary, it may be best to exclude it at the view retrieval stage, or to extract user organization information via Entra ID and dynamically output data only to the relevant organizations.
The data selected here will be used as the data source for the subsequent non-routine data analysis.
Non-routine Data Analysis
Natural language-based data analysis is performed against the previously configured data source.
Based on user requirements, the system proposes report ideas and constructs the necessary SQL.
To minimize misunderstandings and avoid black-boxing, we include a user confirmation step where the SQL to be executed is presented for pre-approval.
The current implementation is quite simple as a baseline, but in practice, it will be important to design which aspects the AI agent should confirm with users based on actual use cases, such as time periods, granularity, time series vs. year-over-year comparisons, whether to prioritize a summary overview or detailed fact listings.
However, since users can interact with data interactively using natural language, there is no need for rigid upfront requirements definition. Users can generate reports through trial and error while viewing the actual generated reports.
For spot analysis purposes, this is sufficient. If users want to reuse created reports, they can save them via the "Save Report" button and access them anytime from the report list.
One important point here is that the LLM generates only the HTML template, while data embedding is handled by the program. Anyone who has tried to have an LLM create reports with embedded data knows that since LLMs return text, a naive approach results in reports with massive amounts of numerical data embedded directly in the response.
For simple summaries this is fine, but when data volume is large, such as table displays, the LLM's token count and cost increase significantly, and response times become very slow.
To avoid this, the LLM is tasked with generating only the HTML template for data embedding, and when saving reports, only the HTML template and the SQL to execute are stored.
Report List
This feature allows users to browse reports saved through the data analysis function in a list view. By pressing the refresh button on each report, users can fetch the latest data from the data source and update the report at any time.
As explained earlier, since the HTML template and SQL are saved separately, there is no need to call the LLM when refreshing reports. The update simply involves programmatically embedding SQL execution results into the report, enabling fast updates. An export function is also provided with report distribution in mind.
Since HTML and SQL are saved, created reports can be fine-tuned at any time. The construction cost is inherently low, so reports can be discarded whenever they are no longer needed.
This enables flexible data utilization in areas that were previously hard to reach, such as reports for small groups, reports needed only for specific periods, or analysis reports specialized for particular products or campaigns.
Future Expansion Considerations
There are various possible directions, so let us briefly consider future expansions.
Skill Definitions
The definition of skills is likely the most important aspect for organizational use.
At minimum, the following three areas need to be considered:
- Report Design Skills (report designs tailored to use cases)
- Dataset Usage Skills (supplementary information and metadata for datasets including business context, reference SQL, etc.)
- Analysis Skills (codifying organizational analysis perspectives and approaches as knowledge)
Regarding report design skills, the preferred report design inevitably varies by organization and use case.
Corporate colors are one factor, but there are many others: whether abstract high-level reports are preferred or detailed reports that allow fact-tracing, whether visually rich three-dimensional designs are desired or simpler, more minimalist reports are actually preferred. If mobile use during travel is common, mobile views or responsive design should be prioritized.
While it is good to allow fine-tuning via prompts, whether or not a good result (what you actually want) appears on the first attempt is a critical point for effort reduction, so report skills tailored to the organization need to be refined over time.
Next is the dataset usage skill. Datasets store numerical data, but they do not store the meaning of that data.
For example, "revenue" can have various definitions. In practice, calculating revenue might require adding Column A and Column B, or using Column D's value when Column C is zero. Such considerations inevitably arise when using data. The semantic information associated with each dataset needs to be defined as a skill, and for particularly complex cases, sample SQL should also be prepared.
This requires personnel who deeply understand both the business-side requirements and the internal data infrastructure. Without these skill definitions, the AI will often struggle, leading to rework and additional prompt instructions.
This is the same as hiring an exceptionally talented data scientist and simply handing them a database. Without understanding what the organization requires or what the data means, they cannot proceed with their work.
Another important area is analysis skills. It is beneficial to define organizational analysis perspectives and approaches as skills. The process of forming hypotheses, analyzing data, and verifying hypotheses is inherently iterative, and naturally one person has limitations. Therefore, it is advisable to organize previously effective analysis perspectives and approaches for organization-wide reuse, with LLM support for analysis.
When relying purely on a default LLM for analysis, the results tend to be generic. However, this knowledge itself becomes an organizational asset that strengthens competitiveness. While the challenge of making documented knowledge practically reusable has existed, AI now facilitates that reuse.
Expanding Data Sources
While this article focuses primarily on database analysis via Text-to-SQL, there will certainly be cases where users want to reference internal documents or include external data sources in their final reports.
However, simply connecting everything does not necessarily improve output quality. Indiscriminately adding sources can lead to AI context pollution, so this should be approached with caution.
Since adding data sources and defining usage skills go hand in hand, an approach of refining one source at a time before adding the next will ultimately be faster than adding everything that seems potentially useful and then sorting through it.
Adding data sources is inherently easy and tempting, but the trade-offs must be properly understood. At minimum, adding data sources via MCP in bulk just because they might be useful someday is unacceptable. This also requires domain expertise from personnel who thoroughly understand their company's business and use cases.
From an AI perspective as well, providing the minimum set of sources that contain the necessary information, reverse-engineered from the objective, tends to yield better accuracy. To make steady progress in what remains a highly experimental field, it is important to avoid repeating the mistakes of the Big Data era.
On the "BI is Dead" Argument
Whenever this kind of topic comes up, the question "Do we even need BI anymore?" almost inevitably arises. While there is no definitive answer, I would like to share my perspective here.
First, all-or-nothing arguments are generally wrong, and the relationship between AI and BI is fundamentally about division of roles.
For example, when LLMs emerged, the "RPA is dead" argument also surfaced frequently. But for extracting data from systems that only support GUI interaction with no API or database access, RPA is the only option. While having AI recognize screens is one approach, trying to have AI judge and reproduce clearly fixed procedures every time is obviously inefficient in terms of speed, cost, and stability. It is better to implement such processes using logic-based tools like RPA or web scraping.
Regarding BI, AI should be leveraged effectively in areas where BI has traditionally been cumbersome, such as non-routine analysis, temporary visualizations, and personal use. On the other hand, having individuals redundantly perform similar analyses or create reports through trial and error is wasteful, so areas that are essential for the organization should be built out as high-quality BI reports.
BI should be used in areas where quality and reliability are paramount, such as KPI governance, audit compliance, financial reporting, access control and scope management, reproducibility guarantees, and SLA-backed reporting.
One aspect that is both a strength and weakness of AI is that it will produce a reasonable-looking response even when it is somewhat incorrect. BI, being programmatic, will reliably surface errors when data is corrupted.
Furthermore, with BI, the process involves engineers understanding, defining, and implementing how revenue should be calculated, for example. With AI, there is a possibility that it will autonomously use columns that seem to correspond to revenue. A report might look fine at first glance but use incorrect calculation methods, or handle NULLs and missing values inappropriately. This is why I emphasized earlier that dataset skill definitions are essential.
This applies beyond this domain: the flexibility and reliability of AI are inherently in tension, so it is necessary to assess whether BI or AI is more appropriate for each use case.
Additionally, attempting to do everything with AI would likely lead to building out row-level security, logging, access control, separation of development and production environments, and reporting features, essentially recreating a BI tool from scratch. Rather than extreme all-or-nothing arguments, the prudent approach is to use each tool according to its strengths.
Personally, I am agnostic about the means as long as the objective is achieved, and I intend to continue using both BI and AI where each is best suited. In fact, one of the things I am most excited about with AI is improving the efficiency of the BI development process.
The challenge during BI planning and requirements definition is that users often cannot clearly articulate what kind of report they want at the outset. In many cases, we receive a rough image, present a report prototype, gather feedback, and iterate through this cycle several times.
This is somewhat inevitable, as users cannot concretely envision what they want without actually seeing a report. When reproducing a user's rough image as a prototype, the colors might be worse than expected, or the visual hierarchy might be unclear. There might be cases where it is better to extract totals into card-format displays, or where filters would be more appropriate than displaying everything at once. Since there is no single correct answer in design, the final deliverable's design typically differs from the user's initial sample.
This process is critically important, but it requires the development team to interpret even the elements users cannot articulate (sometimes missing the mark significantly), making the effort substantial.
If AI agents are used here, for example, having users first iterate and share their report image ideas would allow the project to proceed with much higher resolution from the very beginning, improving communication efficiency for both sides. In some cases, it might be feasible to collaboratively build a screen mockup in a single hour-long screen-sharing discussion.
Unlike wireframes, the backend is connected to actual data sources, so the report includes real numbers, and unexpected considerations such as outliers might surface at this stage.
Once the report image is finalized using AI agents, it simply needs to be implemented as a BI report with quality refinements and published to the organization. AI is extremely fast at creating 70-80 point prototypes, so leveraging AI for this initial velocity enables more efficient downstream processes. If the resolution of alignment during requirements definition can be elevated in this way, the quality of the final deliverable should also improve.
Conversely, for cases where "addressing this with BI feels like overkill, but we can't just ignore it either," an AI agent can create the report. If the generated HTML template and SQL pass review, there is no need to redevelop it in BI. Reproducibility is guaranteed as long as the LLM is not used during updates.
While there will be much to explore going forward, rather than debating AI versus BI, it is best to view AI as a new tool added to the solution set for advancing data utilization.
Leveraging AI Agents to Promote Data-Driven Culture
From here, I would like to discuss how to leverage AI agents and the effects and directions we want to promote in organizational use.
1. Raising Awareness of Data Infrastructure Across the Organization
While the discussion so far has focused on the application layer, the most important issue for an organization is "whether the necessary data infrastructure is properly maintained."
Ultimately, even with excellent AI or BI engineers, if the underlying data quality is very poor, or if data has not been digitized from analog formats, data analysis and report creation simply cannot be performed. Conversely, when the data infrastructure is maintained at a very high quality, even standard AI or BI engineers can produce higher-quality reports than in the former scenario.
Trying to compensate for data-side problems with application-side AI is highly inefficient. To improve AI output quality, rather than revisiting AI processing, the priority should be improving the data quality itself. While I mentioned the importance of dataset skill definitions, the ideal is to create a state where AI can intuitively operate by looking at the database without needing skill definitions.
However, when users are told "data quality matters" without seeing a clear exit point for data utilization, it is hard for them to internalize. From an executive perspective as well, it is difficult to justify allocating investment budgets to data infrastructure upfront.
Therefore, by first providing a data visualization environment through AI agents like the one discussed here, the current state of the organization's data infrastructure becomes visible to people beyond just data engineers.
If the prototype receives positive feedback during its rollout, as users begin using it, conversations like the following emerge:
"Can't we get this kind of data?" → "That data isn't being fed from the source system, so we can't provide it."
"The numbers seem off somehow..." → "There appear to be days when data wasn't entered, which creates missing values."
"Why does this show up as separate data when it should be the same thing?" → "Master data hasn't been organized, and each department has been issuing its own IDs."
In this way, challenges in the organization's data environment gradually come to light.
When challenges become visible in this concrete manner, the issue of "data quality matters" suddenly gains a sense of urgency.
Admittedly, properly entering data is a chore for frontline staff, but when the results of their work are clearly visualized and shared across the organization, it can foster a greater awareness of data input quality. As this awareness grows further, it may even lead to discussions like, "Since upstream quality assurance is critical, let's automate data entry through system integration."
As this cycle of quality assurance from the input phase, data cleansing, and database infrastructure maintenance becomes more active, the quality and development efficiency of both AI and BI improve, and further acceleration of data utilization can be expected.
2. Supporting Data Validation
As I have repeatedly emphasized, data infrastructure maintenance is the most critical factor. Therefore, using AI to support data validation processes and visualize issues is an effective approach.
For example, connecting AI to the data infrastructure and having it check from perspectives such as:
- Whether dimensions and facts are cleanly separated
- Whether dataset/table/column names are consistent with the actual data they contain
- Whether duplicate tables exist across projects (potential dual management)
- Whether values that should never be negative or zero are present
- Whether obvious outliers or anomalies exist relative to surrounding data
- Based on the overall dataset content, what data might be missing or where granularity issues might exist
In practice, additional business-perspective check criteria would be included. Database infrastructure maintenance is not a one-time effort; if neglected, quality gradually degrades, including declining input data quality.
Therefore, by conducting not only static checks but also semantic validation leveraging AI as a regular process, data quality can be maintained, and the output quality of all applications, including both BI and AI, can be improved.
I believe the ideal approach is to continuously refine check criteria while automating the reporting of results. The ability to perform semantic checks in addition to program-based static checks is a significant advantage.
3. Next-Action Support
One of the greatest strengths of LLMs and one of the biggest differences from BI is the ability to handle natural language.
Data visualization and analysis have no value in themselves. What matters most is whether they lead to concrete actions and whether they prompt those actions.
With BI, while comparisons against thresholds and increases/decreases are expressed, interpreting the numerical reports is ultimately left to humans.
In other words, in the flow of Report → Interpretation → Action, how to bridge the gap between Report and Interpretation has always been a challenge for BI. If AI, which can handle natural language, can support this gap, the probability of driving action can be improved.
Therefore, by supplementing traditional reports with AI-generated analysis perspectives, insights, and improvement suggestions, the initial cognitive load of interpretation can be reduced.
As briefly mentioned in the context of data source expansion, for example in sales, when a report shows declining new contract numbers or rising churn rates, looking at the numbers alone might leave people asking "What's happening?" But by also examining meeting minutes from deal discussions, it becomes possible to smoothly connect data interpretation with actionable next steps, including root cause analysis that numbers alone cannot express.
This is, in a sense, common sense. When you ask a subordinate to analyze data and they report back with only a neatly organized numerical report, you would internally want to say, "The data is well organized, but I wish you had also thought about what we should do next and made a recommendation."
Given that AI is available, planning for this extension to next-action support is another important consideration. Ultimately, this takes the form of fitting BI and AI into UX design that encompasses the entire business process.
Conclusion
In this article, we examined the potential of non-routine data analysis with AI agents and the promotion of organizational data utilization.
AI has the potential to support the entire data utilization process, from data infrastructure maintenance, visualization, and analysis to next-action planning.
The key is to first make data visible to users (creating a sense of immediacy), then to maintain and improve data infrastructure quality. Including skill definitions tailored to organizations and use cases, this is in practice a very methodical process.
I hope this article serves as a useful reference for exploring AI agent applications going forward.